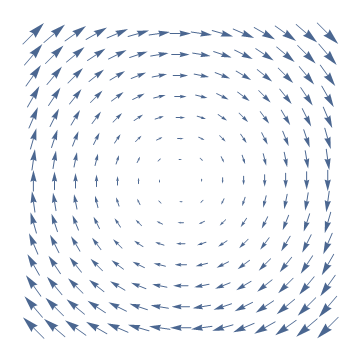
1、矢量场{y, -x}图像如下:
VectorPlot[{y, -x}, {x, -3, 3}, {y, -3, 3}, Axes -> False, Frame -> False]
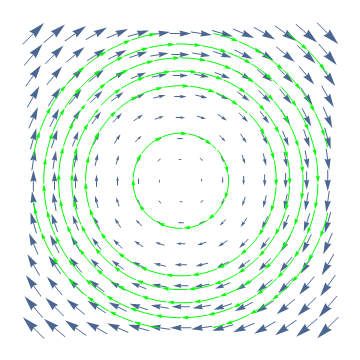
2、加上10条流线图,就可以看出这个矢量场的走势是一组同心圆:
VectorPlot[{y, -x}, {x, -3, 3}, {y, -3, 3}, Axes -> False,
Frame -> False, StreamPoints -> 10, StreamStyle -> Green]
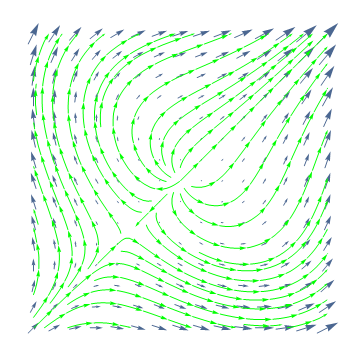
3、矢量场{y^2 + x, y^2 - x}的图像比较混乱,所以画上36条流线。
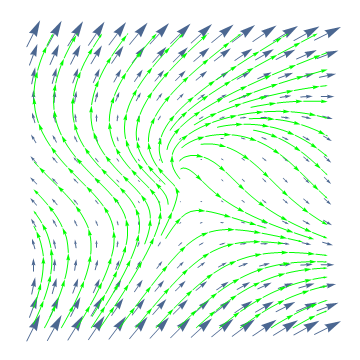
4、{y^2 + x, x^2 + y}:
VectorPlot[{y^2 + x, x^2 + y}, {x, -3, 3}, {y, -3, 3}, Axes -> False,
Frame -> False, StreamPoints -> 36, StreamStyle -> Green]
5、扩大画图范围:
VectorPlot[{y^2 + x, x^2 + y}, {x, -10, 10}, {y, -10, 10},
Axes -> False, Frame -> False, StreamPoints -> 36,
StreamColorFunction -> Hue]
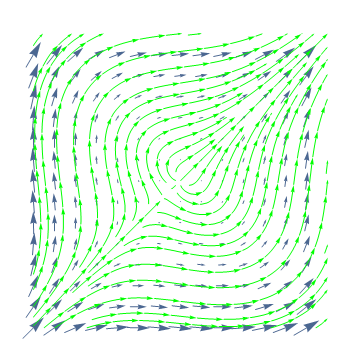
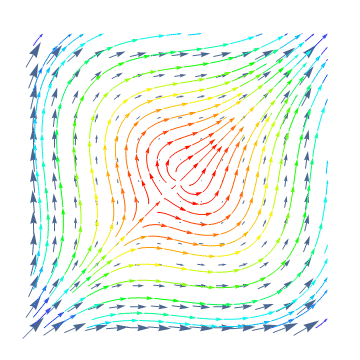
6、彩色流线:
VectorPlot[{y^2 + x, x^2 + y}, {x, -10, 10}, {y, -10, 10},
Axes -> False, Frame -> False, StreamPoints -> 36,
StreamColorFunction -> Hue]