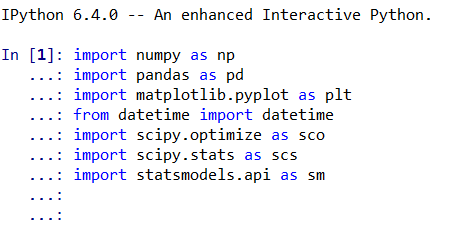
1、导入相关包和模块
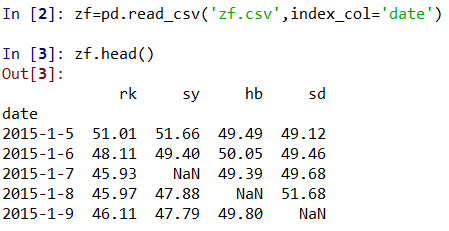
2、读取数据 zf=pd.read_csv('zf.csv',index_col='date')
并查看前5项 zf,head()
3、对缺失值的删除操作 zf=zf.dropna()
对数据的时间序列操作 zf.index=pd.to_datetime(zf.index)

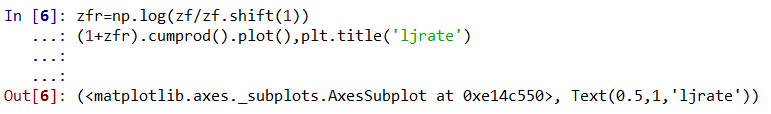
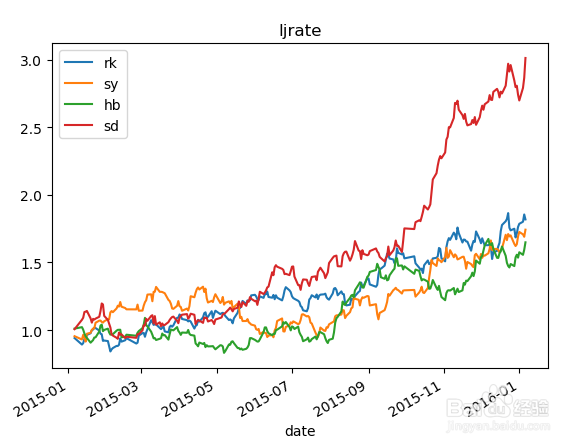
4、连续收益率 zfr=np.log(zf/zf.shift(1))
累积收益率分布图 (1+zfr).cumprod().plot(),plt.title('ljrate')
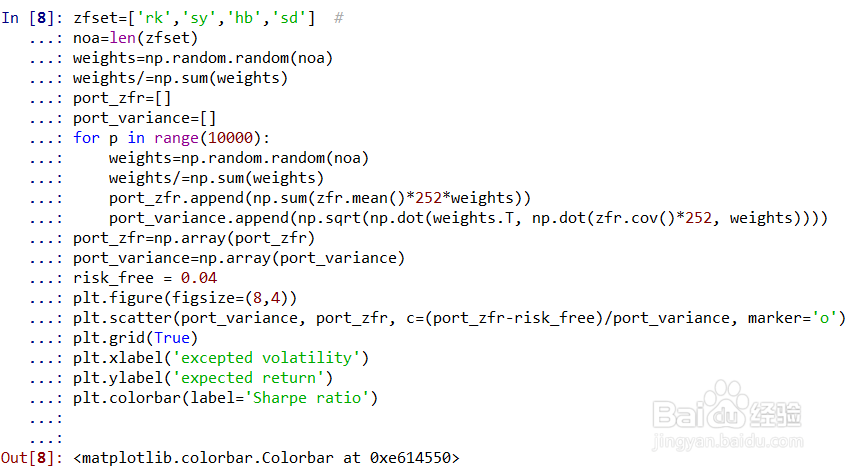
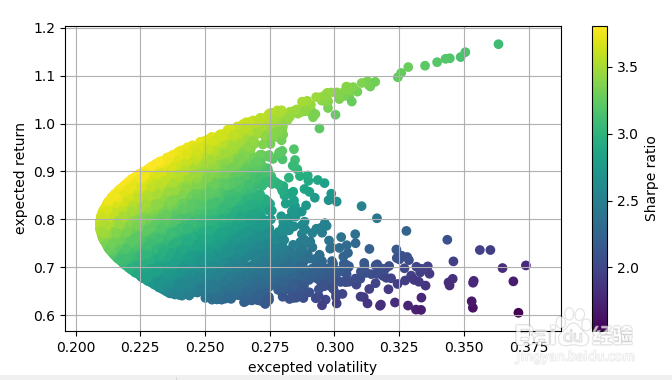
5、做大量的随机资金权重相应的收益率与方差值
zfset=['rk','sy','hb','sd']
noa=len(zfset)
weights=np.random.random(noa)
weights/=np.sum(weights)
port_zfr=[]
port_variance=[]
for p in range(10000):
weights=np.random.random(noa)
weights/=np.sum(weights)
port_zfr.append(np.sum(zfr.mean()*252*weights))
port_variance.append(np.sqrt(np.dot(weights.T, np.dot(zfr.cov()*252, weights))))
port_zfr=np.array(port_zfr)
port_variance=np.array(port_variance)
risk_free = 0.04
plt.figure(figsize=(8,4))
plt.scatter(port_variance, port_zfr, c=(port_zfr-risk_free)/port_variance, marker='o')
plt.grid(True)
plt.xlabel('excepted volatility')
plt.ylabel('expected return')
plt.colorbar(label='Sharpe ratio')